The first part of this analysis, Offensive Archetypes, sorted nearly a decade of rotation-caliber players into 9 offensive roles using a model built entirely on in-game tendencies -- what a player does, not how well they do it. That left one obvious question unanswered: which players are actually good at their role? This article answers that, with a formula for each archetype that now scores players based on volume and efficiency rather than tendency.
A Quick Recap: The 9 Archetypes
| Archetype | What they tend to do |
|---|---|
| Shot Creator | Dribble-heavy, pull-up scoring that's mostly unassisted |
| Spot Up Spacer | Lowest usage of any archetype, catch-and-shoot heavy, almost all assisted |
| Movement Shooter | Off-screen and handoff possessions, high 3PT share, stays out of the paint |
| Inside Out Big | Roll man / cutter / screener with an added catch-and-shoot wrinkle |
| Utility Big | Moderate interior touches and screen assists, no single standout trait |
| Initiator | Highest usage of any archetype -- elite drive volume, isolation reps, fouls drawn |
| Rim Runner | Dunks, cuts, offensive rebounding, shortest average shot distance |
| Mid-Post Creator | Post touches, mid-range, and real passing -- the "do-everything" tier |
| Post Anchor | The single most extreme feature in the whole model -- post-touch volume well above everyone else |
How the Ranking Works
Each archetype gets its own weighted formula, scoring players only against others in their own archetype. Every formula follows the same structure: volume/production stats outweigh efficiency stats, which outweigh role-specific stats (based on the archetype tendencies found in the initial analysis), which outweigh availability (minutes and games played). This is designed to try to prevent cases where an efficient low-volume player scores higher than a high-volume producer.
The formulas are created based on each archetype's defining cluster features from the Offensive Archetypes analysis. A Shot Creator's formula weights assists, pull-up makes, and drive-and-kick passing the heaviest, because that's what separates Shot Creators from one another. A Post Anchor's formula weights post-up scoring and screens set, because that's what separates post players from each other. Every feature gets standardized within that player's own archetype and season, so a 2016-17 Spot Up Spacer is only ever measured against other 2016-17 Spot Up Spacers -- never against a different season or a different role.
See the full formula for each archetype
Every stat below is z-scored within the player's own archetype and season before being weighted -- the numbers in these tables are the weights of each stat (how much each stat counts), not the stats themselves. Again, tiers follow the same hierarchy in every formula: volume/production outweighs efficiency, which outweighs role-based stats, which outweighs availability.
Shot Creator
| Stat | Weight | Tier |
|---|---|---|
| Assists | 0.16 | Volume/production |
| Pull-up jump shot makes | 0.13 | Volume/production |
| Drive-and-kick passes | 0.10 | Volume/production |
| Points scored | 0.09 | Volume/production |
| Pick-and-roll ball-handler scoring | 0.08 | Volume/production |
| 3-point makes | 0.07 | Volume/production |
| Isolation scoring | 0.07 | Volume/production |
| Assist rate | 0.06 | Efficiency |
| High-dribble pull-up efficiency | 0.05 | Efficiency |
| Assist-to-turnover ratio | 0.04 | Efficiency |
| Pick-and-roll ball-handler efficiency | 0.03 | Efficiency |
| Mid-range pull-up efficiency | 0.02 | Efficiency |
| 3-point percentage | 0.02 | Efficiency |
| Isolation efficiency | 0.01 | Efficiency |
| Handoff efficiency | 0.01 | Efficiency |
| Minutes per game | 0.04 | Availability |
| Games played | 0.02 | Availability |
Utility Big
| Stat | Weight | Tier |
|---|---|---|
| Post-up scoring | 0.15 | Volume/production |
| Screens set | 0.11 | Volume/production |
| Pick-and-roll roll-man scoring | 0.10 | Volume/production |
| Offensive rebounds | 0.09 | Volume/production |
| Cut makes | 0.08 | Volume/production |
| Dunk makes | 0.07 | Volume/production |
| Fouls drawn | 0.06 | Volume/production |
| Post-up efficiency | 0.05 | Efficiency |
| Offensive rebound rate | 0.05 | Efficiency |
| Pick-and-roll roll-man efficiency | 0.04 | Efficiency |
| Interior 2-point finishing | 0.03 | Efficiency |
| Cut efficiency | 0.02 | Efficiency |
| Post touch volume | 0.04 | Role confirmation |
| Elbow touch volume | 0.03 | Role confirmation |
| Paint touch volume | 0.02 | Role confirmation |
| Minutes per game | 0.04 | Availability |
| Games played | 0.02 | Availability |
Rim Runner
| Stat | Weight | Tier |
|---|---|---|
| Dunk makes | 0.14 | Volume/production |
| Screens set | 0.13 | Volume/production |
| Offensive rebounds | 0.11 | Volume/production |
| Cut scoring | 0.11 | Volume/production |
| Layup makes | 0.09 | Volume/production |
| Offensive rebound rate | 0.07 | Efficiency |
| Layup conversion rate | 0.06 | Efficiency |
| Dunk efficiency | 0.05 | Efficiency |
| Interior 2-point finishing | 0.04 | Efficiency |
| Pick-and-roll roll-man efficiency | 0.03 | Efficiency |
| Cut efficiency | 0.01 | Efficiency |
| Paint touch volume | 0.05 | Role confirmation |
| Elbow touch volume | 0.03 | Role confirmation |
| Post touch volume | 0.02 | Role confirmation |
| Minutes per game | 0.04 | Availability |
| Games played | 0.02 | Availability |
Initiator
| Stat | Weight | Tier |
|---|---|---|
| Assists | 0.16 | Volume/production |
| Drives to the basket | 0.13 | Volume/production |
| Fouls drawn | 0.11 | Volume/production |
| Drive-and-kick passes | 0.10 | Volume/production |
| Points scored | 0.08 | Volume/production |
| Isolation scoring | 0.07 | Volume/production |
| Pick-and-roll ball-handler scoring | 0.07 | Volume/production |
| Assist rate | 0.06 | Efficiency |
| Mid-range pull-up efficiency | 0.06 | Efficiency |
| High-dribble efficiency | 0.05 | Efficiency |
| Isolation efficiency | 0.03 | Efficiency |
| Post-up efficiency | 0.01 | Efficiency |
| Pick-and-roll ball-handler efficiency | 0.01 | Efficiency |
| Minutes per game | 0.04 | Availability |
| Games played | 0.02 | Availability |
Movement Shooter
| Stat | Weight | Tier |
|---|---|---|
| 3-point makes | 0.15 | Volume/production |
| Off-screen makes | 0.14 | Volume/production |
| Handoff makes | 0.11 | Volume/production |
| Jump shot attempts | 0.10 | Volume/production |
| Corner-3 makes | 0.08 | Volume/production |
| Spot-up scoring | 0.07 | Volume/production |
| Off-screen efficiency | 0.06 | Efficiency |
| 3-point percentage | 0.06 | Efficiency |
| Handoff efficiency | 0.05 | Efficiency |
| Spot-up efficiency | 0.04 | Efficiency |
| Transition efficiency | 0.02 | Efficiency |
| Off-ball movement speed | 0.06 | Role confirmation |
| Minutes per game | 0.04 | Availability |
| Games played | 0.02 | Availability |
Post Anchor
| Stat | Weight | Tier |
|---|---|---|
| Post-up scoring | 0.17 | Volume/production |
| Screens set | 0.12 | Volume/production |
| Fouls drawn | 0.10 | Volume/production |
| Interior 2-point makes | 0.09 | Volume/production |
| Free throw makes | 0.07 | Volume/production |
| Post-up efficiency | 0.06 | Efficiency |
| Offensive rebound rate | 0.06 | Efficiency |
| Pick-and-roll roll-man efficiency | 0.05 | Efficiency |
| Interior 2-point finishing | 0.04 | Efficiency |
| Short pull-up efficiency | 0.02 | Efficiency |
| Playmaking out of the post | 0.02 | Efficiency |
| Post touch volume | 0.05 | Role confirmation |
| Elbow touch volume | 0.05 | Role confirmation |
| Paint touch volume | 0.04 | Role confirmation |
| Minutes per game | 0.04 | Availability |
| Games played | 0.02 | Availability |
Spot Up Spacer
| Stat | Weight | Tier |
|---|---|---|
| Corner-3 makes | 0.20 | Volume/production |
| 3-point makes | 0.17 | Volume/production |
| Catch-and-shoot makes | 0.14 | Volume/production |
| Jump shot attempts | 0.11 | Volume/production |
| Spot-up scoring | 0.08 | Volume/production |
| 3-point percentage | 0.06 | Efficiency |
| Catch-and-shoot effective FG% | 0.06 | Efficiency |
| Spot-up points per possession | 0.06 | Efficiency |
| Transition efficiency | 0.04 | Efficiency |
| Off-screen efficiency | 0.02 | Efficiency |
| Minutes per game | 0.04 | Availability |
| Games played | 0.02 | Availability |
Inside Out Big
| Stat | Weight | Tier |
|---|---|---|
| Pick-and-roll roll-man scoring | 0.13 | Volume/production |
| Dunk makes | 0.12 | Volume/production |
| Screens set | 0.10 | Volume/production |
| Cut makes | 0.08 | Volume/production |
| Offensive rebounds | 0.08 | Volume/production |
| Total rebounds | 0.07 | Volume/production |
| 3-point makes | 0.07 | Volume/production |
| Pick-and-roll roll-man efficiency | 0.06 | Efficiency |
| Offensive rebound rate | 0.05 | Efficiency |
| Dunk efficiency | 0.04 | Efficiency |
| Catch-and-shoot effective FG% | 0.04 | Efficiency |
| Layup conversion rate | 0.03 | Efficiency |
| Post-up efficiency | 0.02 | Efficiency |
| Cut efficiency | 0.01 | Efficiency |
| Paint touch volume | 0.04 | Role confirmation |
| Minutes per game | 0.04 | Availability |
| Games played | 0.02 | Availability |
Mid-Post Creator
| Stat | Weight | Tier |
|---|---|---|
| Post-up scoring | 0.14 | Volume/production |
| Fouls drawn | 0.11 | Volume/production |
| Interior 2-point makes | 0.10 | Volume/production |
| Isolation scoring | 0.07 | Volume/production |
| Points scored | 0.07 | Volume/production |
| Mid-range makes | 0.06 | Volume/production |
| Assists | 0.06 | Volume/production |
| Post-up efficiency | 0.05 | Efficiency |
| Assist rate | 0.05 | Efficiency |
| Mid-range pull-up efficiency | 0.05 | Efficiency |
| Interior 2-point finishing | 0.03 | Efficiency |
| Isolation efficiency | 0.03 | Efficiency |
| Off-screen efficiency | 0.03 | Efficiency |
| Post touch volume | 0.05 | Role confirmation |
| Elbow touch volume | 0.04 | Role confirmation |
| Minutes per game | 0.04 | Availability |
| Games played | 0.02 | Availability |
Two final scores get saved, both 0-100:
- OFF_SCORE -- normalized across the archetype's entire ten-year history. The best player x season combination ever recorded in that archetype scores 100; everyone else is relative to that one season.
- OFF_SCORE_SZN -- normalized within that single season only. The best player in that archetype for that specific year scores 100.
The season-specific score is the one that matters for "who's having the best year?" This is the score that the rest of the article uses as well.
One thing worth noting before results: every score below only scores players in their specific archetype (from the Offensive Archetypes article) and only compares the players to others assigned to that same archetype that season. Because of this, there may be players that aren't scored in a specific archetype, even though their game might fit or excel in that role. Steph Curry is the clearest example -- he's classified as an Initiator every season in this analysis, so that's the only archetype he's eligible to get a score for. But when scoring him in the other formulas, Curry would grade as high as 100.0 as a Movement Shooter (2018-19) and 98.7 as a Spot Up Spacer the same season -- both higher than most players actually assigned to those archetypes that year. The archetype label is just a classification based on his tendencies each season, not a ceiling on how talented or versatile the player is; more on this in the Limitations section below.
The Best Seasons on Record, By Archetype
This table shows the players that achieved a score of 100 in the OFF_SCORE metric, indicating they were the best player in that archetype across all seasons that were analyzed. Again, players are only scored in the archetype they were classified as. Giannis may have been the best at rim-running, but if he was classified as a Post Anchor, then he won't get a score for Rim Runner.
| Archetype | Best Player x Season |
|---|---|
| Initiator | Russell Westbrook, 2016-17 |
| Shot Creator | Darius Garland, 2021-22 |
| Movement Shooter | Malik Beasley, 2024-25 |
| Spot Up Spacer | Danny Green, 2018-19 |
| Rim Runner | Rudy Gobert, 2016-17 |
| Utility Big | Nikola Jokić, 2016-17 |
| Inside Out Big | Donovan Clingan, 2025-26 |
| Mid-Post Creator | Giannis Antetokounmpo, 2024-25 |
| Post Anchor | Nikola Jokić, 2024-25 |
2025-26 Leaders, By Archetype
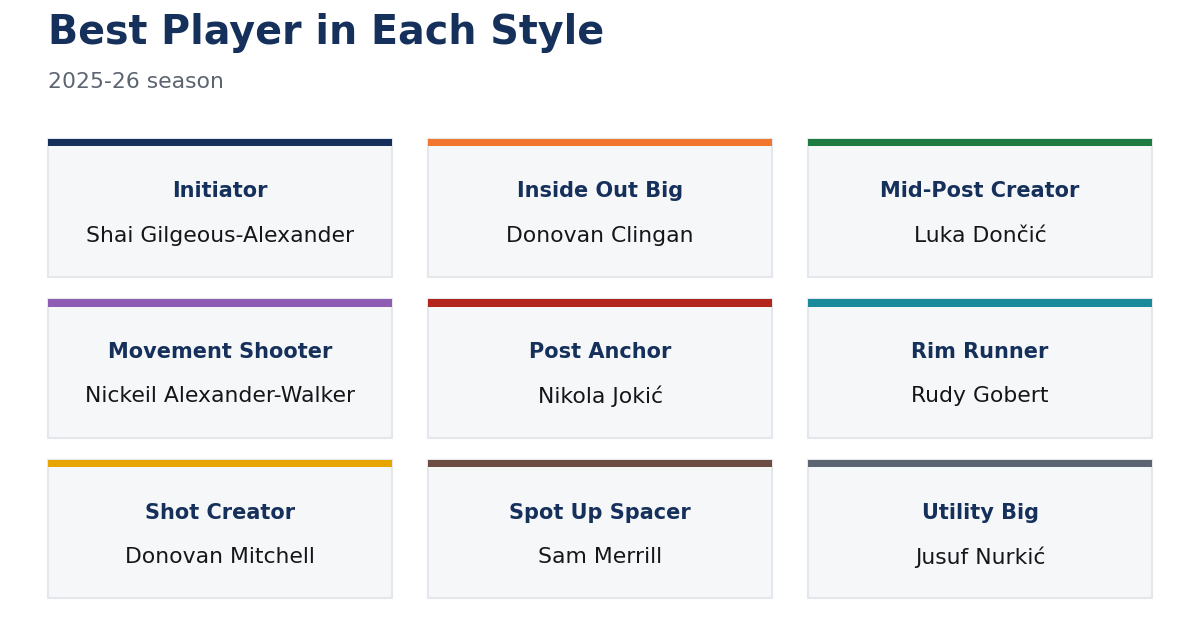
| Archetype | 2025-26 leader |
|---|---|
| Initiator | Shai Gilgeous-Alexander |
| Shot Creator | Donovan Mitchell |
| Movement Shooter | Nickeil Alexander-Walker |
| Spot Up Spacer | Sam Merrill |
| Rim Runner | Rudy Gobert |
| Utility Big | Jusuf Nurkić |
| Inside Out Big | Donovan Clingan |
| Mid-Post Creator | Luka Dončić |
| Post Anchor | Nikola Jokić |
This is a good sanity check on the formulas themselves -- Jokić leading Post Anchors and Shai Gilgeous-Alexander leading Initiators are who most NBA fans would expect to see there. On the other hand, Donovan Clingan being the top Inside Out Big is a bit of a surprise, as he isn't necessarily known for having the outside game, though he did extend his range this previous season.
Just for some additional context, archetypes have varying degrees of success and talent in their player pool. Post Anchor has both the highest average score (51.8) and the tightest spread (std. dev. 16.5) of any archetype -- there are only 202 true post-up bigs in ten seasons, indicating the ones who still play that way tend to excel in that role. Shot Creator, the most common archetype at 824 player-seasons, has one of the widest spreads (std. dev. 21.1), since that role covers everyone from All-NBA guards to end-of-bench guys.
Versatility vs. Specialization
When scoring every player x season combo in all 9 formulas, not just their own assigned archetype, it is easy to see which players are specialists and which players can take on various responsibilities.
The versatile players. Using a threshold of scoring 70+ (on the 0-100 within-season scale) to be considered "elite," Nikola Jokić grades elite in 7 of the 9 archetype formulas this past season. Giannis Antetokounmpo is elite in 6. This is the data-supported version of the scouting report for these players: basically no weaknesses, impossible to stop them on offense.
The specialists. Some players have a huge gap between their own archetype score and how they'd score everywhere else. Neemias Queta and Rudy Gobert both score 90+ as Rim Runners while averaging barely 40 across the other 8 archetypes -- elite at one thing, and don't expect them to stray from that. This isn't necessarily a bad thing, as Rudy Gobert has had a successful career setting screens and rolling to the rim. Shai Gilgeous-Alexander shows the same pattern from the perimeter: a 98.4 as an Initiator against a 54.1 average everywhere else. His game is predicated on getting himself (and others) good shots off the dribble. This playstyle has led to back-to-back MVPs for Shai.
An interesting but not very surprising note is Jokić showing up in both groups at once -- the single most versatile offensive player in the dataset by cross-archetype score, and also the best at his own archetype specifically.
A Few Player Trends Worth Tracking
Note: these charts plot OFF_SCORE_SZN -- a player's score within whichever archetype they were actually classified as that season, not a blend of all 9 formulas. When a player's archetype changed, the line keeps going, but the formula being applied changed underneath it.
Shai Gilgeous-Alexander's rise. SGA's within-season score has gone 45.1 → 54.4 → 91.3 → 90.0 → 98.9 → 100.0 → 100.0 → 100.0 from his second season through 2025-26, including a reclassification from Shot Creator to Initiator as his usage increased. This shows his historic, unexpected rise, and it also calls for a Chris Paul shoutout since he played with Shai in Shai's second season.
Shai Gilgeous-Alexander -- archetype score by season
Nikola Jokić's sustained peak. In 2017-18, Jokić took on the role of Post Anchor, switching from a Utility Big role. In 2020-21, he became the best Post Anchor in the league and has held that title for 6 years straight.
Nikola Jokić -- archetype score by season
Jalen Brunson's role change. Brunson classified as a Shot Creator from 2018-19 through 2020-21, then shifted to Initiator from 2021-22 onward as his role changed with the Knicks. His score increased from 58.3 to a peak of 92.0 in 2024-25, before dropping to 76.0 in 2025-26 -- a real dip worth watching, though Mike Brown changed the offensive scheme, so Brunson was not relied upon as heavily as an Initiator. This also shows potential limitations of this analysis, since Brunson just had his most successful season and won Finals MVP. The decrease in his score is simply a reflection of his game not fitting entirely into the Initiator role and formula this past season.
Jalen Brunson -- archetype score by season
Look Up Any Player
Check or uncheck an archetype to show how that player would score against that formula, every season -- not just the seasons they were actually classified that way. Note: these cross-archetype scores are normalized against every player that season, not just players in that archetype -- so they won't match the OFF_SCORE_SZN charts above, which are normalized only within the archetype itself. That's why, for example, Jokić's 2016-17 shows a perfect 100 as a Utility Big earlier in this article, but a lower score for that same season here.
Loading player data...
Limitations and What's Missing
The formulas are based on the initial analysis, but they are influenced by my own opinion on things like how the weighting should work. The weights (why assists get 0.16 for a Shot Creator while 3-point makes get 0.07) are judgment calls that were tweaked multiple times in the creation of this analysis. There is no strict right-or-wrong answer to how these formulas should be built.
Other limitations worth mentioning:
- No defense anywhere. This is an offense-only analysis by design, but it means a great two-way player and a pure offensive specialist can post the same score if their offensive production matches -- the formulas have no way to tell them apart and don't try to.
- No strength-of-opponent or context adjustment. Offensive production was not weighted differently based on matchup, context, difficulty, etc. If a player only produced when his team was already losing by 20, the formulas do not know that or take that into consideration.
- The scoring system relies on an accurate archetype classification. If a player's style genuinely blends two archetypes (see the Offensive Archetypes article's blend-detection rules), their scoring formula only scores them in whichever single archetype they were assigned. Steph Curry may fall under the Initiator archetype and receive a score for that, but he could be the best Spot Up Spacer or Movement Shooter in any given season, as was discussed previously.
- Within-archetype and within-season only. A 60 as a Spot Up Spacer and a 60 as a Shot Creator doesn't mean those players are equal -- they're each relative only to other players in that same role and that same year. The cross-archetype scores get closer to an apples-to-apples comparison, but those are still built from the same hand-weighted formulas, not an independent measure of true value.
- Standardizing within season means the bar moves every year. A 100 ten years ago in a role could be better or worse than a 100 this year. It all depends on how well the players in that role perform that given year. There may be many more Inside Out Bigs in the current NBA than there used to be, so a player scoring 80 in this archetype may actually be better at the role than a player scoring 100 in that role in the past.
The Takeaway
Evaluating players within their role is one of the most difficult and also important jobs in sports. This article uses archetype-specific formulas to score players across 9 offensive archetypes in the NBA. The results mostly pass the eye test: Jokić and SGA on top of their respective archetypes, specialists and versatile players showing up where they should, etc. The formulas are a mix of analysis and opinions, not objective truth. Looking at roster breakdowns by archetype is the next step -- see Team Construction and Success by Offensive Archetype for what these same archetypes and scores look like at the team level, and find out if there is any correlation between archetypes and team success.