NBA offensive talent is at an all-time high, leading to the most complex and efficient offenses the league has seen. With player skillsets evolving, roles are no longer restricted by position, and many of the prototypical archetypes are on the verge of extinction. This analysis aims to understand the offensive archetypes across the association, what each archetype tends to do on the floor, and the players that make up each one. Using nearly a decade of tracking, shot-location, and play-type data, every rotation-caliber player since 2016 has been sorted into one of nine actual offensive archetypes.
Scope and Methodology
This analysis covers 2016-17 through 2025-26 -- ten full seasons -- pulled from the NBA's tracking, synergy, and shot-location data. This data was limited to players who actually have an offensive role worth classifying -- players must have reached at least 10 minutes per game and 25 games played in a season. That still leaves a pool of 3,832 player-seasons, averaging close to 380 players per season, covering everyone from fringe rotation guys to franchise cornerstones.
For the analytical approach, a different clustering method was considered initially -- k-means -- but offensive roles in today's NBA don't split into nine perfectly clean buckets. Many players take on various roles in the offense depending on the matchup or the lineup around them, and forcing every player into exactly one label doesn't make sense. The approach best suited to the data and this thought-process is a Gaussian Mixture Model (GMM), which gives every player a probability across all nine archetypes. The advantage is this actually captures role overlap instead of pretending it doesn't exist. The tradeoff is a slightly messier answer in some cases -- "roughly half Initiator, half Spot Up Spacer" can be more vague than just describing a player as an "Initiator."
Analysis
Every feature that went into the clustering had to pass one test: does it describe what a player does, not how well they do it? This is a deliberate choice -- mixing in metrics that are results-based rather than tendency-based defeats the entire point of a style classification. Nothing like PER, true shooting percentage, or offensive rating is included in the analysis. Instead, the model runs on 48 features across five categories:
- Shot-zone frequency (where shots come from on the floor)
- Shot creation (how many dribbles before a shot, and whether it was assisted)
- Synergy play type (isolation, post-up, spot-up, pick-and-roll, cut, handoff, off-screen, transition, etc.)
- Tracking volume (touches, drives, passes, speed)
- Various role and rebounding stats (usage rate, assist rate, screen assists, offensive rebound rate)
See all 48 features used in the model
Shot zone and shot profile -- where and how a player scores
| Feature | What it measures |
|---|---|
| FREQ_RA | Share of shots taken in the restricted area |
| PAINT_NON_RA_FGA | Non-restricted-area paint shot attempts |
| FREQ_MID_RANGE | Share of shots from mid-range |
| FREQ_CORNER_3L / FREQ_CORNER_3R | Share of shots from the left/right corner 3 |
| FREQ_ABOVE_BREAK_3 | Share of shots from above-the-break 3 |
| FREQ_LAYUP | Share of shots that are layups |
| FREQ_DUNK | Share of shots that are dunks |
| AVG_SHOT_DISTANCE | Average distance of all field goal attempts |
| PCT_FGA_2PT | Share of all shot attempts that are 2-pointers |
| PCT_PTS_2PT_MR | Share of total points from 2-point mid-range shots |
| PCT_PTS_3PT | Share of total points from 3-pointers |
| PCT_PTS_PAINT | Share of total points scored in the paint |
| PCT_UAST_FGM | Share of made shots that were unassisted |
Shot creation -- how the shot got created
| Feature | What it measures |
|---|---|
| PTSHOT_C_AND_S_FGA_FREQUENCY | Share of shots that were catch-and-shoot |
| PTSHOT_1_DRIB_FGA_FREQUENCY | Share of shots off exactly 1 dribble |
| PTSHOT_2_DRIB_FGA_FREQUENCY | Share of shots off exactly 2 dribbles |
| PTSHOT_3_6_DRIB_FGA_FREQUENCY | Share of shots off 3-6 dribbles |
| PTSHOT_7P_DRIB_FGA_FREQUENCY | Share of shots off 7+ dribbles |
Synergy play type -- what kind of possession it was
| Feature | What it measures |
|---|---|
| SYN_TRANSITION_POSS_PCT | Share of possessions in transition |
| SYN_ISOLATION_POSS_PCT | Share of possessions in isolation |
| SYN_PRBALLHANDLER_POSS_PCT | Share of possessions as the pick-and-roll ball handler |
| SYN_PRROLLMAN_POSS_PCT | Share of possessions as the pick-and-roll roll man |
| SYN_POSTUP_POSS_PCT | Share of possessions in the post |
| SYN_SPOTUP_POSS_PCT | Share of possessions spotting up |
| SYN_HANDOFF_POSS_PCT | Share of possessions off a handoff |
| SYN_CUT_POSS_PCT | Share of possessions off a cut |
| SYN_OFFSCREEN_POSS_PCT | Share of possessions coming off a screen |
| SYN_OFFREBOUND_POSS_PCT | Share of possessions off an offensive rebound |
| SYN_MISC_POSS_PCT | Share of possessions that are miscellaneous play types |
Tracking volume -- touches, drives, and passing
| Feature | What it measures |
|---|---|
| PTSTAT_DRIVES_DRIVES | Drives to the basket per game |
| PTSTAT_DRIVES_DRIVE_PASSES | Passes made out of a drive |
| PTSTAT_POSS_TOUCHES | Total touches per game |
| PTSTAT_POSS_POST_TOUCHES | Post touches per game |
| PTSTAT_POSS_PAINT_TOUCHES | Paint touches per game |
| PTSTAT_POSS_ELBOW_TOUCHES | Elbow touches per game |
| PTSTAT_POSS_AVG_DRIB_PER_TOUCH | Average dribbles per touch |
| PTSTAT_PASS_POTENTIAL_AST | Passes that could have been assists |
| PTSTAT_PASS_SECONDARY_AST | Secondary (hockey) assists |
| PTSTAT_PASS_PASSES_MADE | Total passes made per game |
| PTSTAT_SPEED_AVG_SPEED_OFF | Average speed on offense |
Role and rebounding
| Feature | What it measures |
|---|---|
| USG_PCT | Usage rate |
| AST_PCT | Assist rate |
| AST_TO | Assist-to-turnover ratio |
| PFD | Personal fouls drawn |
| SCREEN_ASSISTS | Screen assists |
| OREB_PCT | Offensive rebound rate |
| PTSTAT_REB_OREB_CHANCE_PCT | Share of available offensive boards actually grabbed |
There are three main steps in the analysis. First, every feature gets scaled within its own season -- a player shooting 8 threes a game in today's NBA could be equivalent to shooting 5 threes a game ten years ago. Second, the scaled features are run through a dimensionality reduction technique (PCA), reducing the 48 down to just 9 components, which allows for cleaner clusters. Third, a range of clusters was tested (5 to 16), and the model arrived at the final result of 9 clusters (a.k.a. offensive archetypes).
Before trusting the result, the whole model was refit five separate times on different random seeds and the archetype assignments were compared across runs to make sure the clustering was consistent and reproducible, not just the product of one lucky run. Across the five runs, the clusters gave similar results, indicating that the model and results are trustworthy and repeatable.
Results
| Archetype | Players (2025-26) | What they tend to do | 2025-26 examples |
|---|---|---|---|
| Shot Creator | 83 | Dribble-heavy, pull-up scoring that's mostly unassisted | Austin Reaves, Derrick White, Donovan Mitchell |
| Spot Up Spacer | 57 | Lowest usage of any archetype, catch-and-shoot heavy, almost all assisted | Toumani Camara, Kelly Oubre Jr., Royce O'Neale |
| Movement Shooter | 53 | Off-screen and handoff possessions, high 3PT share, stays out of the paint | Desmond Bane, Nickeil Alexander-Walker, Cameron Johnson |
| Inside Out Big | 45 | Roll man / cutter / screener with an added catch-and-shoot wrinkle | Donovan Clingan, Derrick Jones Jr., Isaac Okoro |
| Utility Big | 36 | Moderate interior touches and screen assists, no single standout trait | Jabari Smith Jr., OG Anunoby, Dyson Daniels |
| Initiator | 35 | Highest usage of any archetype -- elite drive volume, isolation reps, fouls drawn | Tyrese Maxey, Jamal Murray |
| Rim Runner | 32 | Dunks, cuts, offensive rebounding, shortest average shot distance | Rudy Gobert, Jakob Poeltl, Neemias Queta |
| Mid-Post Creator | 31 | Post touches, mid-range, and real passing -- the "do-everything" tier | Luka Dončić, Kevin Durant, Amen Thompson |
| Post Anchor | 22 | The single most extreme feature in the whole model -- post-touch volume well above everyone else | Nikola Jokić, Joel Embiid, Alperen Sengun |
While many players fit into one archetype cleanly, there are players who fall under multiple archetypes. If a player's second-most-likely archetype still carries at least 25% probability, that player-season is flagged as a blend rather than pretending the smaller role doesn't exist. Across all ten seasons, 16.0% of player-seasons -- about 1 in 6 -- get flagged this way.
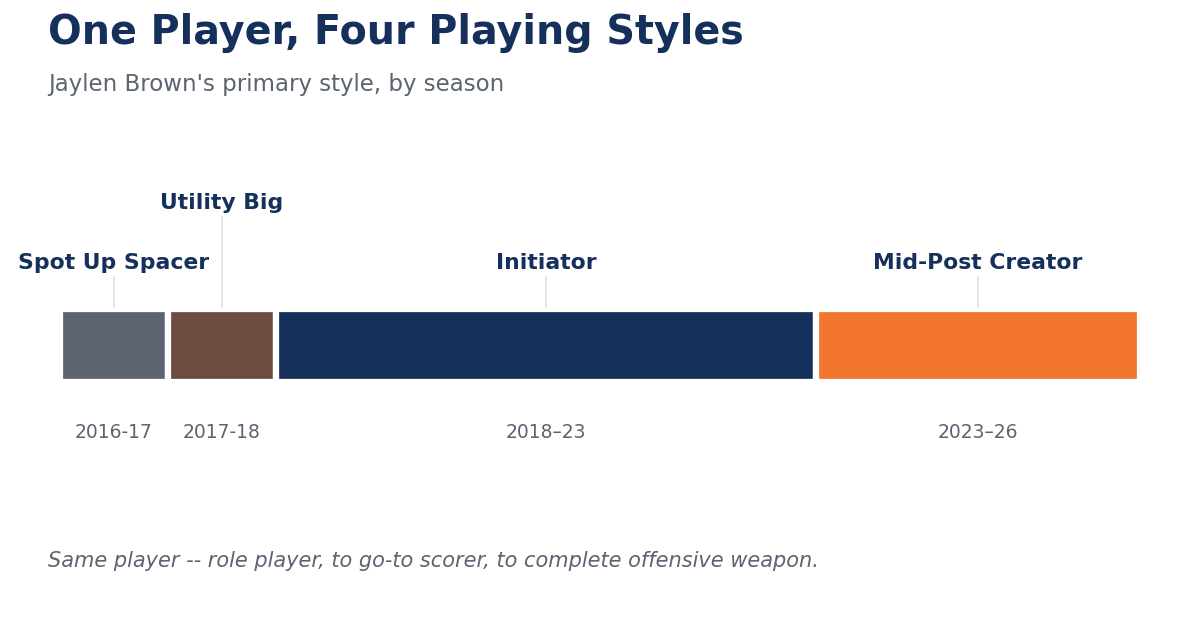
Jaylen Brown this last season is about as clean a blend case as we see: 53.4% Mid-Post Creator, 46.6% Initiator. That aligns with how he's actually used -- enough post-up and mid-range touches to classify as a Mid-Post Creator, but also enough on-ball creation to classify as an Initiator.
On the other end, Nikola Jokić is as close to a pure single-archetype player as this model can produce. He's classified as a Post Anchor at essentially 100% probability. When a player's entire offensive game runs through one specific action or playstyle as completely as Jokić's does through the post, the model has a clear winner.
Additional Context and Design Decisions
The tendency-versus-effectiveness split is the most crucial design philosophy here. Just to restate it -- these archetypes only answer "what does this player do," never "how good are they at it." That second question gets scored separately, in a dedicated ranking system built on top of these same clusters.
That separation matters because it means a player can be a clean fit for an archetype while being far from a complete or productive offensive player within it. Enes Kanter is the clearest case: he ranked #1 in Utility Big for two straight seasons (2017-18, 2018-19), sitting at the 85th-97.5th percentile on nearly every weighted feature in the formula. However, he attempted zero 3-pointers and didn't play as versatile a role as some other players in this archetype.
The flip side shows up constantly, too -- cases where the fit is obviously correct. Jokić reading as Post Anchor at 100% probability is one, as mentioned before; there's no disagreement in that assignment because his actual game matches the label. The Jaylen Brown blend above is the other kind of "right": not a clean single answer, but an accurate one, since his role really does change both across and even within games.
Another thing you will see in the results -- archetypes are not restricted to specific positions. Look at Inside Out Big, for example. Donovan Clingan is a pure center, but Derrick Jones Jr. and Isaac Okoro are wings that just happened to play that role for their team.
Interesting Charts or Facts
Stability over a decade. LeBron James has graded out as a Mid-Post Creator in all ten seasons in this dataset -- 2016-17 through 2025-26. That's as stable as any archetype assignment gets for a player this far into a career.
Real evolution. Jayson Tatum spent his first three seasons (2017-18 through 2019-20) as an Initiator before shifting to Mid-Post Creator starting in 2020-21 and staying there every season since -- this shows Tatum's evolution, as he added a post-game and became more of a PF than a SF over time. Pascal Siakam's path is even more dramatic -- Inside Out Big as a rookie, then Spot Up Spacer, then Utility Big, before finally classifying as a Mid-Post Creator from 2019-20 onward -- four different archetypes across his first four seasons as his role expanded year over year. Giannis Antetokounmpo graded as Mid-Post Creator for nine straight seasons before changing into a Post Anchor this previous year. Giannis' age and injury history may have played a role in this change, and it will be interesting to see how he is used in his first season in Miami.
Note: archetypes a player never crossed 3% probability in are left off these charts -- otherwise every chart would carry 5+ flat lines sitting at zero.
LeBron James -- archetype probability by season
Jayson Tatum -- archetype probability by season
Pascal Siakam -- archetype probability by season
Championship roster construction looks different depending on the team. The 2024-25 Thunder's rotation leaned hard into one archetype: four of their top contributors graded as Spot Up Spacer (Luguentz Dort, Cason Wallace, Alex Caruso, Kenrich Williams), built around a single true engine in Shai Gilgeous-Alexander as Initiator. The 2022-23 Nuggets built differently -- two Post Anchors in the rotation at once (Jokić and Aaron Gordon), plus a more even spread across Initiator, Shot Creator, and Inside Out Big. Different team-building philosophies, both ending in a title.
Positionless basketball shows up in the clusters, too. Gary Payton II, a 6'2" guard, grades as Inside Out Big this season -- an archetype built around rolling, cutting, and screening that's almost always a big man's game. It matches his actual reputation as a lob-catching, rim-running guard. On the other end, Danny Wolf, at 6'11", grades as an Initiator -- a true ball-handling big which is the epitome of positionless basketball.
Look Up Any Player
Loading player data...
Note: archetypes a player never crossed 3% probability in are left off the chart.
The Takeaway
Nine archetypes, built purely on style rather than skill, hold up against both the obvious cases and the ambiguous ones -- a player's role can stay fixed for a decade (LeBron), evolve over time (Siakam, Tatum, and Giannis), or be split between two archetypes (Jaylen Brown). Now that it's clear what every player does on offense, the natural follow-up is how well each one does it within their own role -- see Best Players by Offensive Archetype.