Offensive Archetypes sorted players into 9 offensive roles based on tendency, and Best Players by Offensive Archetype scored how good each player was at those roles. Both articles were focused at the player level. Here, we now shift focus to the team-level, answering this question -- across the last 10 seasons, do winning teams tend to be built a certain way?
Context: this only covers 10 seasons, so there is limited data (only 10 champions and finalists) to go off. These results are mostly an investigation into any patterns we can identify between roster construction and team success.
How This Works
Every team, every season from 2016-17 through 2025-26 (300 team-seasons total), got sorted into a tier based on real playoff outcomes:
| Season | Champion | Runner-up | Conference Finalist |
|---|---|---|---|
| 2016-17 | Golden State | Cleveland | San Antonio, Boston |
| 2017-18 | Golden State | Cleveland | Houston, Boston |
| 2018-19 | Toronto | Golden State | Portland, Milwaukee |
| 2019-20 | LA Lakers | Miami | Denver, Boston |
| 2020-21 | Milwaukee | Phoenix | LA Clippers, Atlanta |
| 2021-22 | Golden State | Boston | Dallas, Miami |
| 2022-23 | Denver | Miami | LA Lakers, Boston |
| 2023-24 | Boston | Dallas | Minnesota, Indiana |
| 2024-25 | Oklahoma City | Indiana | Minnesota, New York |
| 2025-26 | New York | San Antonio | Oklahoma City, Cleveland |
When identifying roster construction and the rotation for each team, we used the same process that the Offensive Archetypes clustering did: anyone averaging 10+ minutes across 25+ games that season counts as a rotation player (9 per team, the "rotation"), and the top 5 of those by minutes count as "starters." There's no reliable position data in this project to assign starters by position -- this minutes-based definition was checked against the real 2025-26 Finals teams and it matched their actual starting fives.
Player Quality Correlates With Winning. Roster Construction Barely Does.
Using every team's archetype score (OFF_SCORE_SZN -- how a player grades against others in their own archetype, that season) averaged across the rotation, there's a moderate relationship with how many games a team wins:
| Metric | Correlation with win % (n = 300) |
|---|---|
| Avg. rotation score within archetype | +0.32 |
| Avg. starters' score within archetype | +0.32 |
| Count of "elite" (70+) rotation players | +0.25 |
| Number of distinct archetypes in the rotation | +0.10 |
| Share of rotation that's a hybrid/blend player | 0.00 |
Having rotation players who grade well relative to their own archetype correlates with winning. Having a wide variety of archetypes on the roster, or a lot of hybrid players, barely moves the needle at all. It's player quality within a role that matters, not how many different roles a team covers.
Minutes Share Is the Clearest Signal
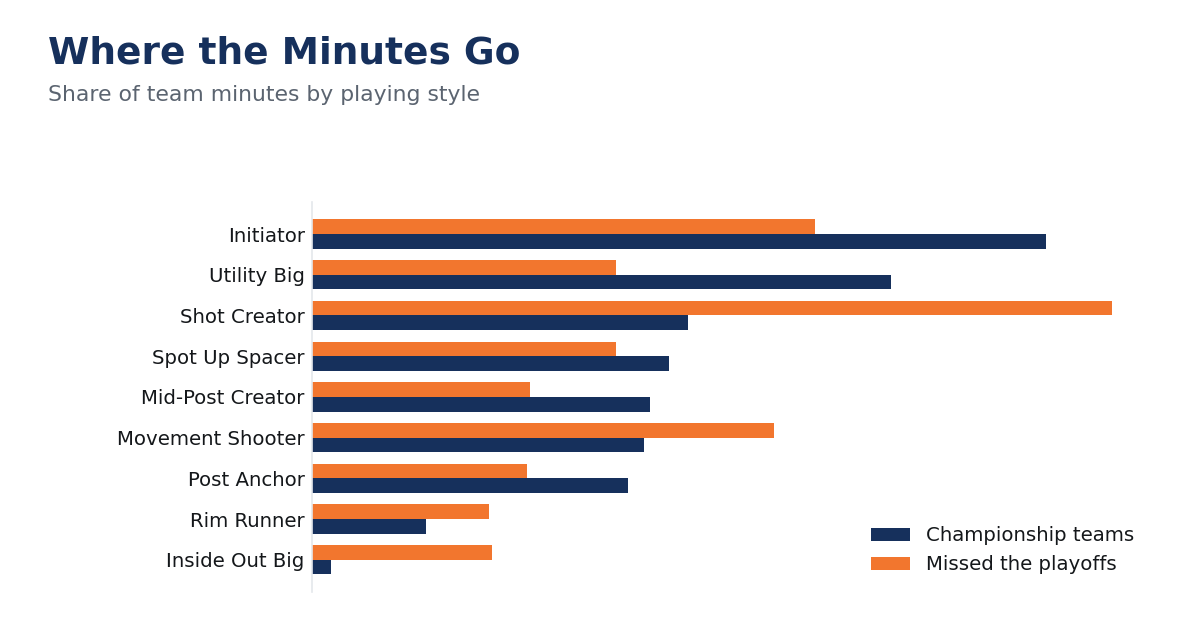
Looking at what share of a team's total rotation minutes go to each archetype turns up the single strongest relationship in this analysis.
Average minutes share (%) by archetype -- Champions
Average minutes share (%) by archetype -- Missed-Playoffs Teams
The more of a team's minutes go to the Shot Creator archetype, the worse that team tends to finish. Champions run only 11.9% of their minutes through Shot Creators; missed-playoffs teams run 25.3% -- more than double.
How Champions are Built
No two champions look alike archetype-for-archetype. The 2019-20 Lakers ran the offense through LeBron (Mid-Post Creator) with shooters around him (Danny Green, KCP). The 2022-23 Nuggets ran their offense through Jokić (Post Anchor) and Jamal Murray (Initiator) pick-and-rolls.
| Season | Champion | Top 2 archetypes by minutes share |
|---|---|---|
| 2016-17 | Golden State | Initiator (30.6%), Utility Big (25.8%) |
| 2017-18 | Golden State | Initiator (28.3%), Utility Big (26.8%) |
| 2018-19 | Toronto | Shot Creator (30.0%), Post Anchor (24.7%) |
| 2019-20 | LA Lakers | Movement Shooter (20.9%), Mid-Post Creator (16.5%) |
| 2020-21 | Milwaukee | Initiator (26.8%), Utility Big (21.1%) |
| 2021-22 | Golden State | Initiator (55.1%), Utility Big (23.7%) |
| 2022-23 | Denver | Post Anchor (26.1%), Initiator (23.4%) |
| 2023-24 | Boston | Mid-Post Creator (28.3%), Shot Creator (23.9%) |
| 2024-25 | Oklahoma City | Spot Up Spacer (31.9%), Movement Shooter (21.4%) |
| 2025-26 | New York | Utility Big (41.6%), Initiator (15.6%) |
What's consistent isn't which archetype leads -- it's that champions almost always concentrate heavily in one or two archetypes rather than spreading minutes thin across many roles. The 2025-26 Knicks are the most extreme recent example: 41.6% of all their rotation minutes went to Utility Big alone (Anunoby, Bridges, and Hart all carry that label), plus another 15.6% to Brunson at Initiator -- more than half the team in just two roles.
The one pairing that does show up again and again: Initiator + Utility Big appears in 9 of the last 10 champions. Every champion except the 2024-25 Thunder (who ran zero minutes at Utility Big at all) carried at least one real Initiator and at least one Utility Big somewhere in the rotation. At the starting-lineup level specifically, Initiator + Post Anchor and Initiator + Utility Big are tied as the most common pairing among champions' starting fives, each showing up in 6 of 10.
A Combo That Wins Games Isn't Always a Combo That Wins Titles
Inside Out Big + Mid-Post Creator is the best example: teams carrying that rotation pairing win at a .523 clip on average, a better regular-season rate than most pairings on this list -- but zero champions in the last 10 years have ever had this combo in their rotation. The pairings that are both common among champions and carry a strong average win rate -- Initiator + Mid-Post Creator (.529, 6 of 10 champions), Mid-Post Creator + Utility Big (.529, 5 of 10 champions).
Bench Depth Doesn't Guarantee Success
Using 60+ (within-archetype score) as "above-average," only 10% of champions carried 2 or more above-average bench players outside their top 5 by minutes -- the lowest rate of any tier that actually wins playoff rounds. Conference finalists (40%) and runners-up (30%) both had deeper benches by this measure than the champions. Several of the last 10 champions won with a top-heavy rotation, not a deep one.
Limitations and What's Missing
- Ten champions is not a lot of data. Every "pattern" here is a description of a small sample, not something that would survive a real statistical test.
- Starters are defined by minutes, not position. This project has no reliable position data, but positions in general have become less reliable in recent years. The top-5-by-minutes definition was checked against the real 2025-26 Finals rosters and matched their actual starting fives, but it can occasionally diverge from a team's nominal starting lineup in-season.
- Archetypes are determined in the regular season. A team's archetype mix and scores are determined entirely from the regular season; star players or role players taking on different roles in the playoffs, or performing at a higher level, is not captured here.
- No defense, no matchups, no context. A team's offensive archetype makeup says nothing about why it won or lost, and we also don't consider how good these teams were at defense.